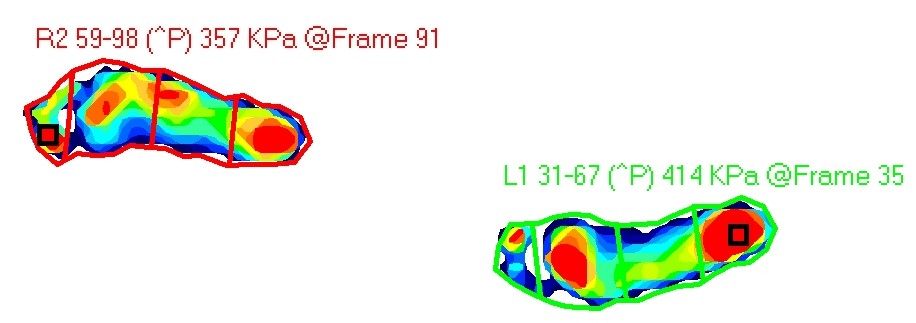
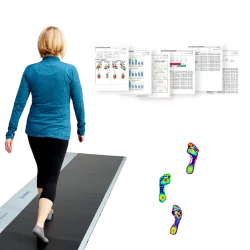
Tekscan provides accurate information empowering clinicians and researchers to increase the validity and effectiveness of treatments and/or research. Regardless of which system you choose, you are obtaining accurate, repeatable data for a broad range of tests and insights. Here are some key pieces of data that Tekscan gait analysis systems provide:
Gait Curves
Also known as the force vs. time graph, a gait curve is a visual representation of the human. Watch this brief video for an introduction to gait curves.
https://youtu.be/HG5YpkpShmQ
Pressure Profiles
Pressure profiles not only provide data that tracks high pressure points and center of force for feet, they also display the data in high-resolution footprints to pinpoint locations. This information can help you identify instability, potential ulcers, stress fractures, and sources of pain in subjects.

Tekscan’s software enables you to segment the foot for detailed analysis. Along with the profiles, you’ll see raw data organized into tables showing temporal and spatial parameters. This combination of information helps with patient education and treatment evaluation in clinical settings and objective data for use in research.